Introduction
Exploratory Data Analysis (EDA) is a crucial step in the data analysis process that involves analyzing and visualizing data sets to summarize their main characteristics. It helps analysts understand the data better and uncover insights that can lead to further analysis and decision-making. We will explore why Business Analytics Online Training is the perfect option for busy professionals looking to enhance their expertise in this in-demand field.
Why is EDA important?
EDA allows data analysts to get a first look at the data they are working with, helping them identify patterns, trends, and outliers that may not be immediately apparent. It also helps in determining the quality of the data and deciding on the appropriate methods for further analysis.
About Business Analytics Training
Business analytics training is a convenient and flexible way to learn the ins and outs of data analysis, statistics, and predictive modeling. With Business Analytics Online Training, you can access high-quality instruction from industry experts from the comfort of your own home or office.
Types of Exploratory Data Analysis
Descriptive Statistics
This includes calculating measures such as the mean, median, mode, variance, and standard deviation. Descriptive statistics provide a high-level overview of the data and help in understanding the basic characteristics of the dataset.
Data Visualization
Data visualization is a powerful technique that involves creating visual representations of data to identify patterns, trends, and outliers. This can be done using various tools such as histograms, scatter plots, box plots, and heat maps. Data visualization helps in gaining a deeper understanding of the data and communicating insights effectively.
Correlation Analysis
This technique helps in determining whether there is a relationship between variables and how strong it is. Correlation analysis is commonly used in predictive modeling and identifying key drivers of a certain outcome.
Clustering Analysis
Clustering analysis is a technique used to group similar objects or data points based on their characteristics. Clustering helps in identifying patterns and structures within the data and can be used for segmenting customers, identifying anomalies, and improving decision-making processes.
Principal Component Analysis (PCA)
Principal Component Analysis (PCA) is a dimensionality reduction technique that is used to reduce the number of variables in a dataset while preserving as much variance as possible. PCA helps in identifying the most important features in a dataset and simplifying complex data structures.
Time Series Analysis
Time series analysis involves analyzing data that is collected over time to identify patterns and seasonal trends. This technique is commonly used in forecasting future trends, understanding historical data patterns, and identifying anomalies in time-dependent data.
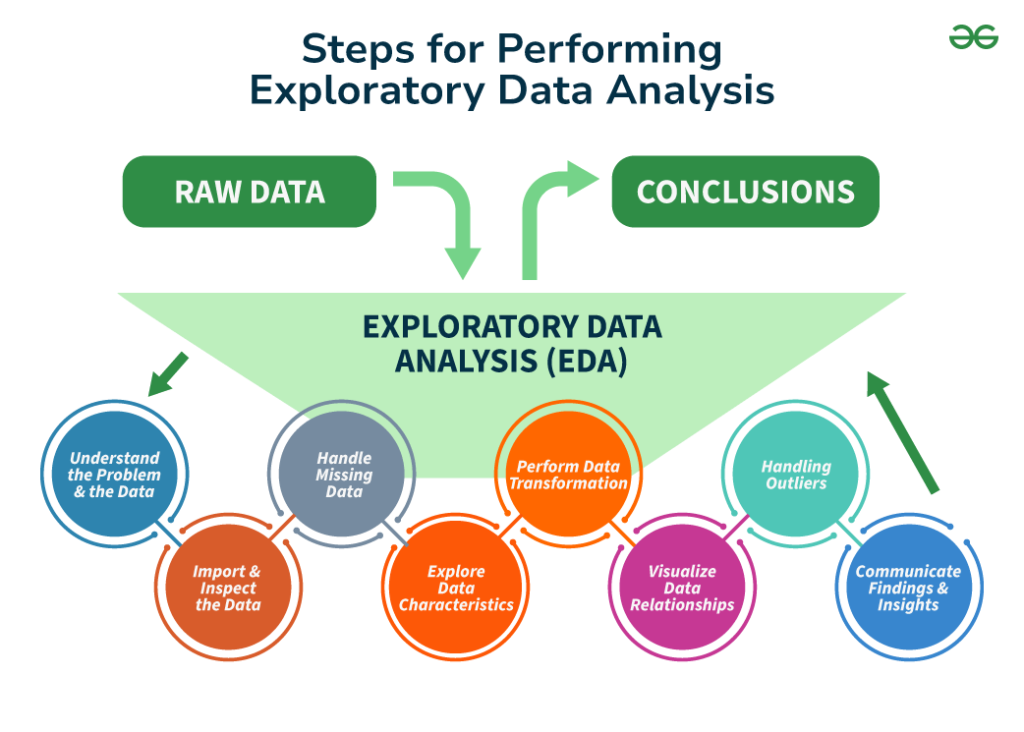
Steps for Performing Exploratory Data Analysis

Understanding the Data
The first step in exploratory data analysis is to gain a thorough understanding of the dataset. This includes exploring the variables, their types, and their relationships with one another. Take a closer look at the data types, missing values, and outliers. By understanding the data, you can better prepare for the analysis ahead.
Cleaning the Data
Once you have a good understanding of the data, the next step is to clean it. Data cleaning is essential to ensure the accuracy and reliability of your analysis. Make sure to use appropriate techniques to clean the data without losing important information.
Visualizing the Data
One of the most powerful tools in exploratory data analysis is data visualization. By creating visualizations such as plots, charts, and graphs, you can uncover patterns and trends that may not be apparent from the raw data. Visualizing the data can help you identify relationships, anomalies, and potential insights that can guide your analysis.
Exploring Patterns and Trends
Once you have visualized the data, it’s time to explore patterns and trends. Look for correlations between variables, trends over time, and any anomalies that may require further investigation. By exploring patterns and trends, you can gain a deeper understanding of the data and identify areas for further analysis.
Drawing Insights
The final step in exploratory data analysis is to draw insights from your analysis. By combining your understanding of the data, data cleaning, visualization, and exploration of patterns and trends, you can uncover valuable insights that can inform decision-making. Make sure to communicate your findings clearly and concisely to stakeholders.
Why Choose Business Analytics Training in Delhi?
If you are wondering why you should choose Delhi for your business analytics training, there are several reasons to consider. This means that Business Analytics Training in Delhi will provide a wide range of real-world data and case studies that can help you understand the practical applications of Business Analytics.
The training covers a wide range of topics, including statistical analysis, data mining, predictive modeling, and machine learning. Business Analytics Training in Delhi, you will learn how to collect, clean, and analyze data to extract valuable insights that can drive business growth and innovation.
Conclusion
Exploratory Data Analysis is a crucial first step in data analysis, allowing data analysts to gain insights and understand the data before diving into more complex analyses. By leveraging techniques like descriptive statistics, data visualization, and correlation analysis, businesses can uncover valuable insights that drive decision-making and business growth.


